
Political essay
Muslims and Non-Muslims Within Western Countries
Important limitation: Most Western countries do not publish offender statistics by religion; therefore crime is treated through data-availability and legal-compliance caveats rather than as a direct Muslim-versus-non-Muslim crime…
English article
A comparative quantitative report on education, employment, socioeconomic outcomes, legal compliance proxies and social integration
Prepared as a scientific report | May 2026
Scope: Germany, Austria, Switzerland, France, United Kingdom, United States, Canada and Australia.
Core comparison: Muslim population compared with non-Muslim, overall population, or national average depending on what the official dataset permits.
Important limitation: Most Western countries do not publish offender statistics by religion; therefore crime is treated through data-availability and legal-compliance caveats rather than as a direct Muslim-versus-non-Muslim crime rate.
Abstract
This report compares Muslim and non-Muslim populations within each country in the previous study. The analysis uses modern civic-integration indicators: employment, unemployment, education, income or housing where available, subjective belonging, discrimination, social contact and crime-data availability. The strongest religion-specific within-country evidence is available for England and Wales through Census 2021 and for the United States through Pew Research Center survey data. The best directly comparable Western European survey evidence remains the Bertelsmann Stiftung Religion Monitor 2017, which compares Muslims with the rest of the population in Germany, Austria, Switzerland, France and the United Kingdom. The principal finding is not uniform failure or uniform success: Muslims show strong national belonging and high inter-group contact in most countries, but employment, income, housing and discrimination gaps remain substantial. Crime data by religion are generally unavailable, and ethnicity, nationality or immigrant background must not be treated as a proxy for Islam.
1. Research question and design
Research question: within each Western non-Muslim country studied, do Muslims differ from non-Muslims or the national average in measurable indicators of integration such as education, employment, economic status, legal compliance and social belonging?
The report separates three types of comparison: (1) direct religion-based comparisons, where official statistics provide Muslim versus overall or non-Muslim outcomes; (2) survey-based Muslim versus rest-of-population comparisons; and (3) non-harmonised evidence, where a country measures religion demographically but does not release the requested labour-market or crime outcomes by religion. This distinction is essential for scientific validity.
2. Methodological cautions
Religion is not ethnicity, nationality, migration status or race. Muslim populations differ by age structure, generation, refugee history, country of origin, language, education of parents and urban concentration.
A crude Muslim-versus-national-average difference can exaggerate disadvantage if Muslims are much younger than the population as a whole. Age-standardised and gender-standardised results are preferable but are not consistently available across countries.
Crime statistics by religion are rarely published. In the UK, for example, criminal justice ethnicity statistics are available, but ethnicity categories such as Asian, Black or White are not religious categories. Using ethnicity or nationality as a proxy for Islam would be an ecological fallacy.
The report therefore treats crime as “not scientifically comparable by religion” unless a source explicitly measures offender religion with adequate controls.
3. Summary table: within-country Muslim vs non-Muslim / national-average comparison
Country | Education comparison | Employment / income comparison | Crime / legal compliance data | Overall interpretation |
|---|---|---|---|---|
Germany | 64% of Muslims born in Germany stayed in school until age 17 or older; educational convergence exists but early tracking slows parity. | Religion Monitor found no significant difference in gainful employment between Muslims and the rest of the population, but Muslims earned significantly less and were more often in low-wage work. | No official offender-rate comparison by religion suitable for Muslim vs non-Muslim analysis. | High labour-market participation but persistent income/class disadvantage. |
Austria | About four in ten Muslims born in Austria left school before 17; 37% of Muslims overall learned German as a childhood language. | Muslim unemployment appears significantly more common than in the average population. | No robust religion-specific crime comparison. | Weakest European case in the Religion Monitor because employment disadvantage, education disadvantage and discrimination converge. |
Switzerland | 74% of second-generation Muslims left school before 17; only 34% learned a national language as children overall. | No significant employment correlation with Muslim religious affiliation, but income is significantly lower than the population average. | No robust religion-specific crime comparison. | Strong belonging and social contact, but weak school-continuation data and lower income. |
United Kingdom | Religion Monitor: only 20% of Muslim children left school before 17. ONS Census 2021: Muslims had 25.3% no qualifications vs 18.2% overall, while Level 4+ was close to overall, 32.3% vs 33.8%. | Religion Monitor: unemployment no higher than average. ONS Census 2021: Muslim employment 51.4% vs 70.9% overall; unemployment 6.7% vs 4.4% overall. | UK criminal justice data are by ethnicity, not religion; no direct Muslim crime-rate comparison. | Mixed: strong education among many, but employment, inactivity, housing and overcrowding gaps remain large. |
France | Only about 11% of Muslims born in France left school before 17; strongest school-continuation outcome in the European survey. | Muslim unemployment 14% vs 8% for non-Muslims; lower employment and income despite education/language strength. | No direct official religion-specific crime comparison. | Strong education/language integration but weak labour-market translation. |
United States | Pew: 31% of Muslim adults are college graduates, closely resembling the general public. | Pew: Muslims are similar for high income over $100k, but more likely to have income under $30k and substantially more underemployed. | FBI/offender data do not provide a Muslim vs non-Muslim crime rate; terrorism/extremism attitudes are not equivalent to crime rates. | Polarised profile: high education and American belonging, but income polarization and underemployment. |
Canada | Census measures religion demographically, but public religion-by-employment/education tables are limited. | Studies report workplace penalties and discrimination for Muslims, especially racialized Muslims and Muslim women, but not a single national table comparable with ONS. | No official Muslim vs non-Muslim crime-rate comparison. | Evidence suggests high belonging with employment/discrimination barriers, but quantitative parity ranking is limited. |
Australia | Census measures religion; Islam was 3.2% of the population in 2021. Public religion-by-labour/crime outcome tables are limited. | No robust national Muslim-vs-non-Muslim employment table was identified in the public ABS summary evidence. | No official Muslim vs non-Muslim crime-rate comparison. | Demographic integration is clear; outcome comparison is not sufficiently published for ranking. |
4. England and Wales: strongest official within-country comparison
The Office for National Statistics provides the clearest religion-specific official comparison. In Census 2021, Muslims aged 16 to 64 had lower employment than the overall population, 51.4% versus 70.9%. Muslim unemployment was 6.7% versus 4.4% overall. The ONS explains that the employment difference was shaped partly by high student status and family-care inactivity among Muslims. In education, Muslims were more likely to have no qualifications, 25.3% versus 18.2% overall, but the share with Level 4 or above was close to the population figure, 32.3% versus 33.8%.
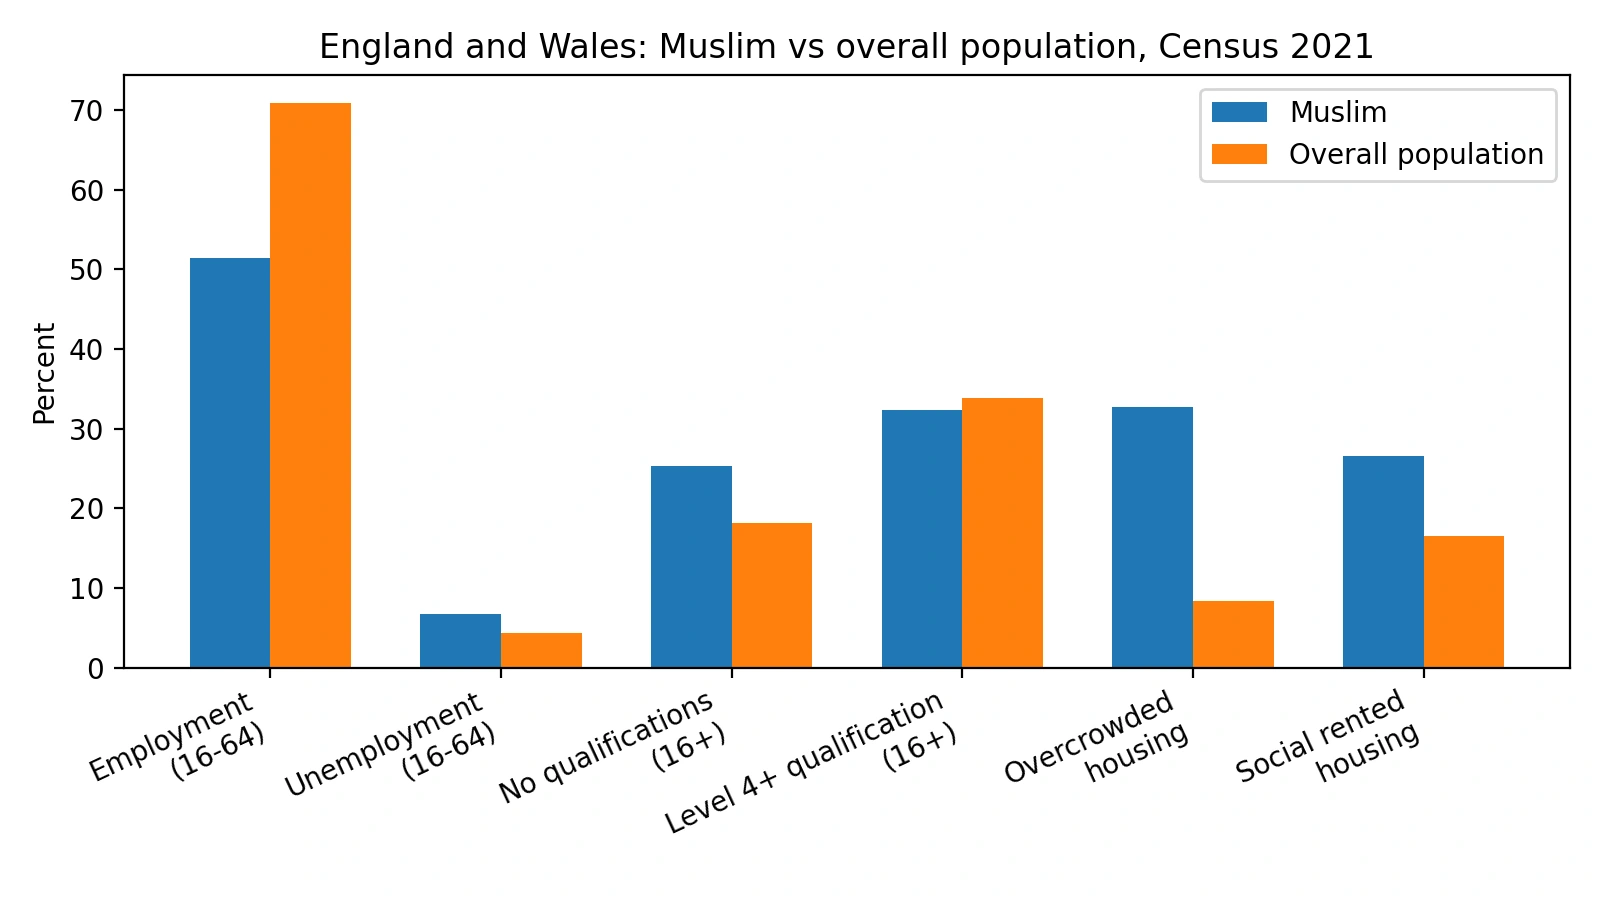
Indicator | Muslim (%) | Overall population (%) | Difference: Muslim minus overall (pp) | Interpretation |
|---|---|---|---|---|
Employment, age 16-64 | 51.4 | 70.9 | -19.5 | Major employment gap, partly explained by student status and family-care inactivity. |
Unemployment, age 16-64 | 6.7 | 4.4 | +2.3 | Higher unemployment. |
No qualifications, age 16+ | 25.3 | 18.2 | +7.1 | Educational disadvantage at lower end. |
Level 4+ qualification, age 16+ | 32.3 | 33.8 | -1.5 | Near parity in higher qualifications. |
Overcrowded housing | 32.7 | 8.4 | +24.3 | Severe housing-density disadvantage. |
Social rented housing | 26.6 | 16.6 | +10.0 | Greater social-housing reliance. |
Interpretation: the UK picture is not simply “low integration”. It is a dual profile. The education distribution shows near parity at degree level but more disadvantage at the “no qualifications” end. The employment gap is large, but official notes indicate it is partly generated by age structure, student status and family-care inactivity, especially among Muslim women. Housing overcrowding is the most striking inequality indicator.
5. Western Europe: Muslim vs rest-of-population comparison from Religion Monitor
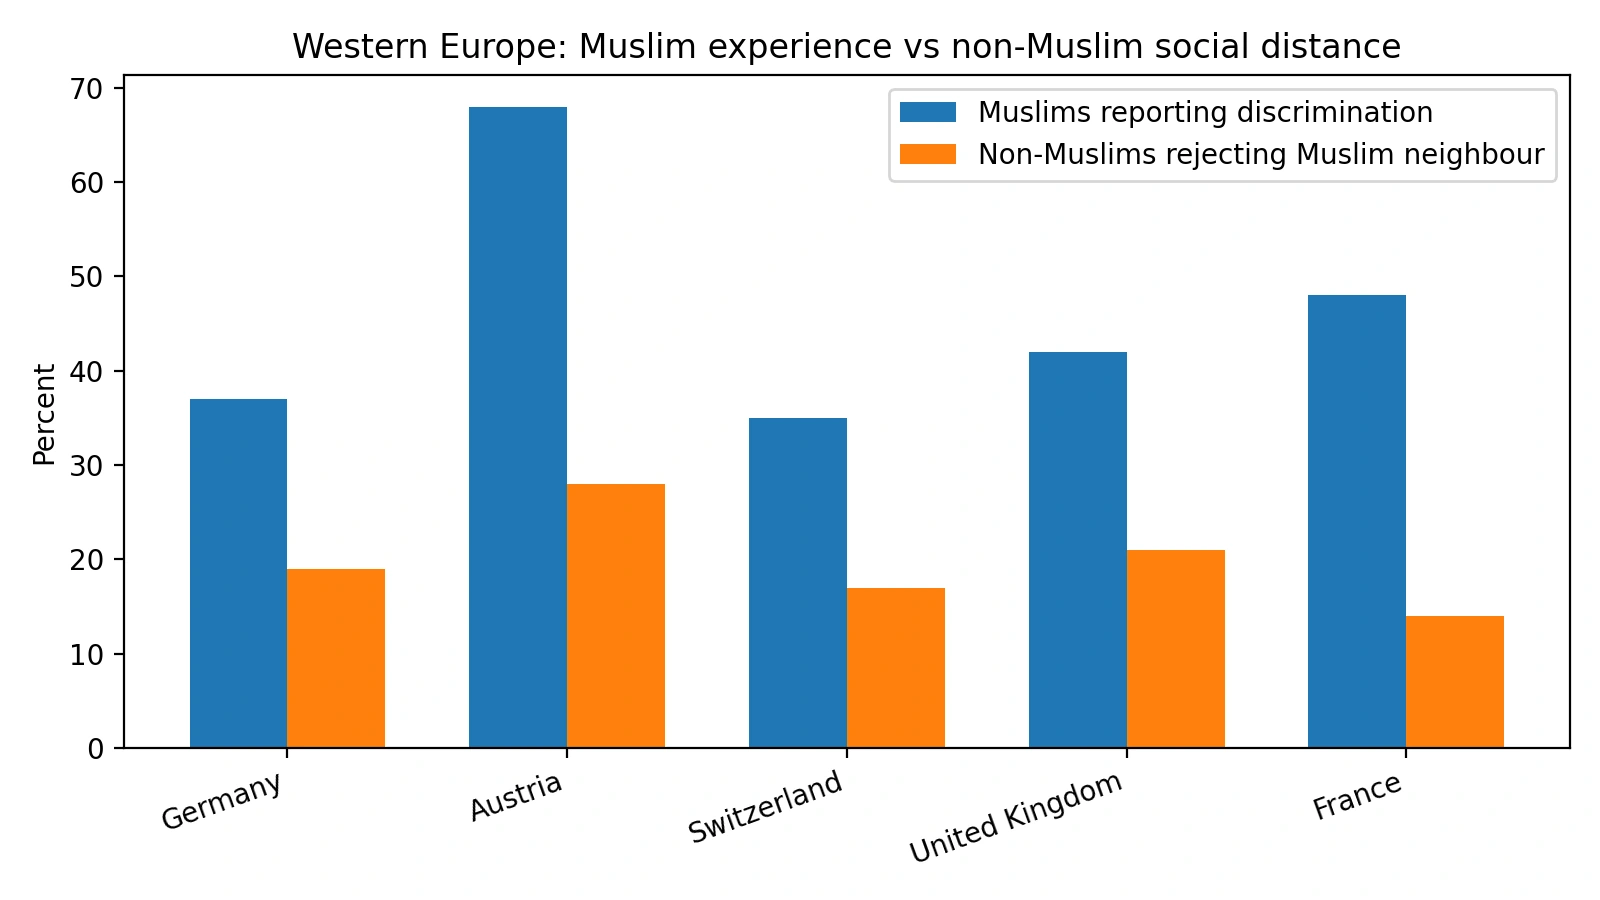
The Bertelsmann Stiftung Religion Monitor compared Muslims with the rest of the population in Germany, Austria, Switzerland, France and the United Kingdom. It is a survey rather than an administrative census, but it is the most coherent cross-national dataset for this question. The key result is that Muslims show high belonging and frequent contact with non-Muslims, while the remaining gaps are mainly labour-market, income, school-system and discrimination gaps.
Country | Muslim age vs non-Muslim age | Education: Muslims born in country | Employment vs non-Muslims / average | Income vs non-Muslims / average | Muslim belonging | Muslim discrimination | Non-Muslim social distance |
|---|---|---|---|---|---|---|---|
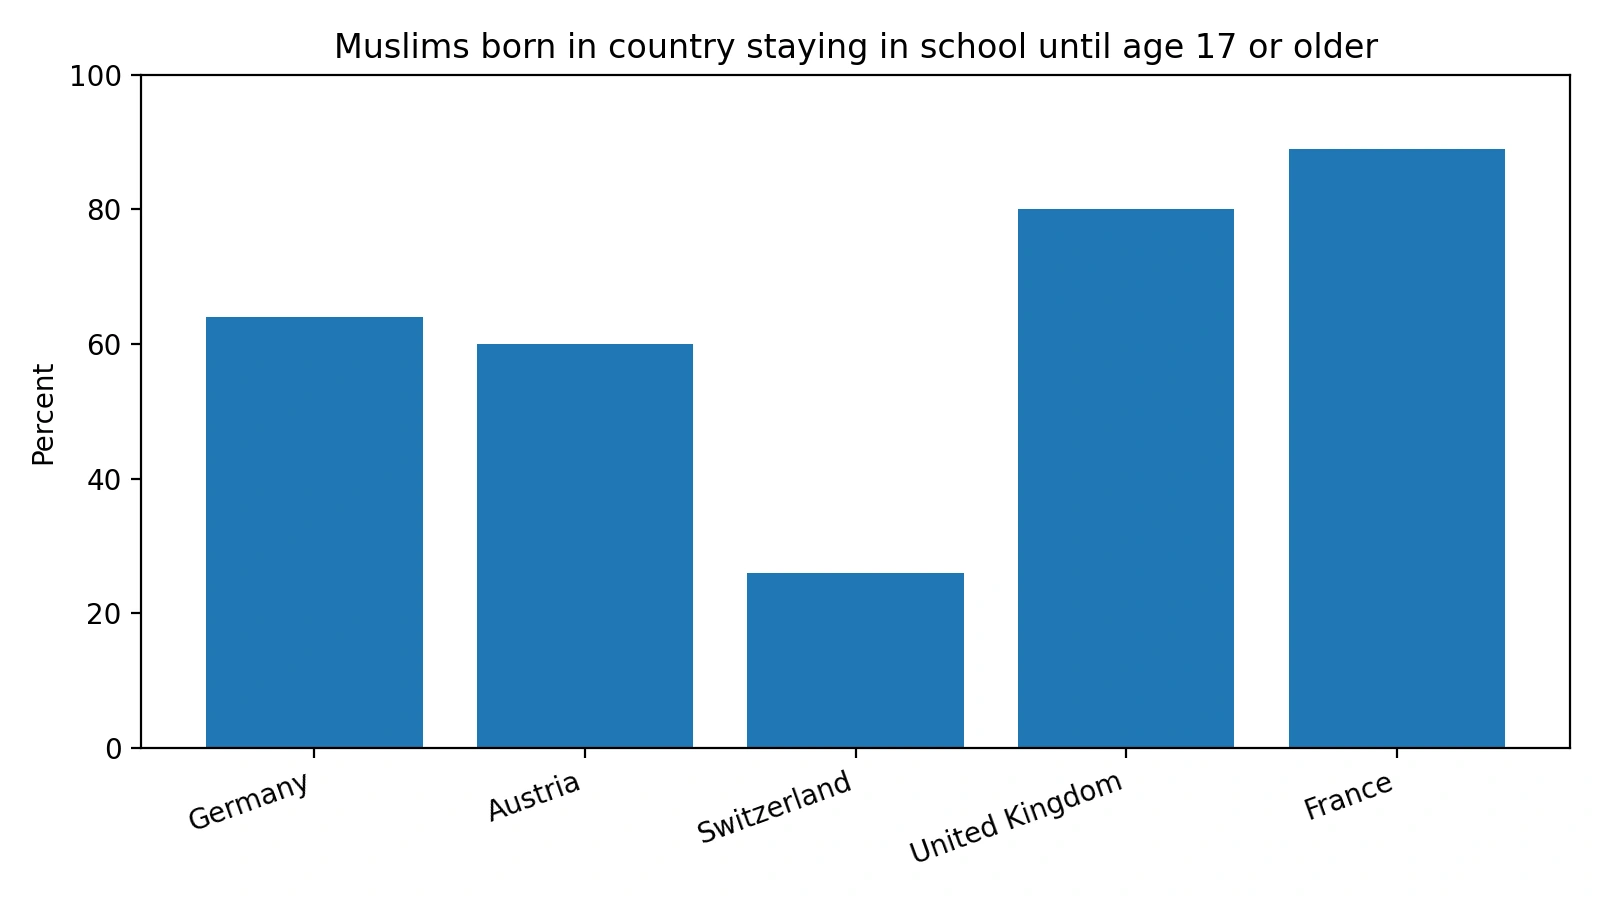
Germany | 38 vs 51 | 64% stayed in school until >=17 | No significant gainful-employment difference | Muslims earn significantly less; more low-wage work | 96% connected | 37% discrimination | 19% would not want Muslim neighbours |
Austria | 35 vs 49 | ~60% stayed until >=17; ~40% left before 17 | Muslim unemployment significantly more common | Lower income implied; less favourable labour outcome | 88% connected | 68% discrimination | 28% would not want Muslim neighbours |
Switzerland | 37 vs 48 | 26% stayed until >=17; 74% left before 17 | No significant employment correlation with Muslim affiliation | Muslims earn significantly less; gap larger than Germany/UK | >98% connected | 35% discrimination | ~17% would not want Muslim neighbours |
United Kingdom | 38 vs 49 | 80% stayed until >=17 | Religion Monitor: unemployment no higher than average | Income disparities lower than Austria/France | 89% connected | 42% discrimination | 21% would not want Muslim neighbours |
France | 40 vs 48 | 89% stayed until >=17; only 11% left before 17 | Muslim unemployment 14% vs 8% non-Muslim | Muslim income lower | 96% connected | 48% discrimination | 14% would not want Muslim neighbours |
6. Country-by-country interpretation
Germany
Germany is the strongest case for labour-market participation: there was no significant difference in gainful employment between Muslims and the rest of the population. The remaining problem is vertical inequality: Muslims earn less and are concentrated more often in low-wage work. Education convergence is present but slowed by early educational tracking.
Austria
Austria shows the clearest gap cluster: Muslims are younger, more likely to face unemployment, more likely to report discrimination, and are exposed to the highest non-Muslim rejection of Muslim neighbours in the five-country comparison. Legal recognition of Islam does not translate automatically into social acceptance or labour-market parity.
Switzerland
Switzerland is paradoxical. It has very high belonging and the highest interreligious leisure contact, and employment participation is not significantly associated with Muslim affiliation. However, education continuation is weak among second-generation Muslims and income remains lower. The country therefore scores well on social integration but less well on educational mobility.
United Kingdom
The UK has two overlapping pictures. The Religion Monitor depicts relatively favourable labour-market assimilation and good school-continuation among Muslims. The ONS Census 2021, however, shows lower employment, higher unemployment, more family-care inactivity, more no-qualification status and much worse overcrowding. The best interpretation is that the UK combines legal-cultural pluralism and an established Muslim population with persistent socioeconomic and housing inequality.
France
France is the strongest educational and language-integration case but not the strongest labour-market case. Muslims born in France are much less likely to leave school before 17 than in Germany, Austria or Switzerland. However, the French labour market does not convert this educational outcome into equal employment: Muslim unemployment is 14% versus 8% for non-Muslims.
7. United States: Muslim vs all adults
Pew Research Center reports that Muslim Americans closely resemble the general public in college graduation: 31% of Muslims were college graduates, including 11% with postgraduate degrees. Muslims were also about as likely as the general public to have household income over $100,000, 24% versus 23%. The disadvantage is concentrated at the lower economic end: 40% of Muslim Americans reported household income under $30,000 versus 32% of the general public, and 29% were underemployed versus 12% of U.S. adults overall. Home ownership was also lower, 37% versus 57%.
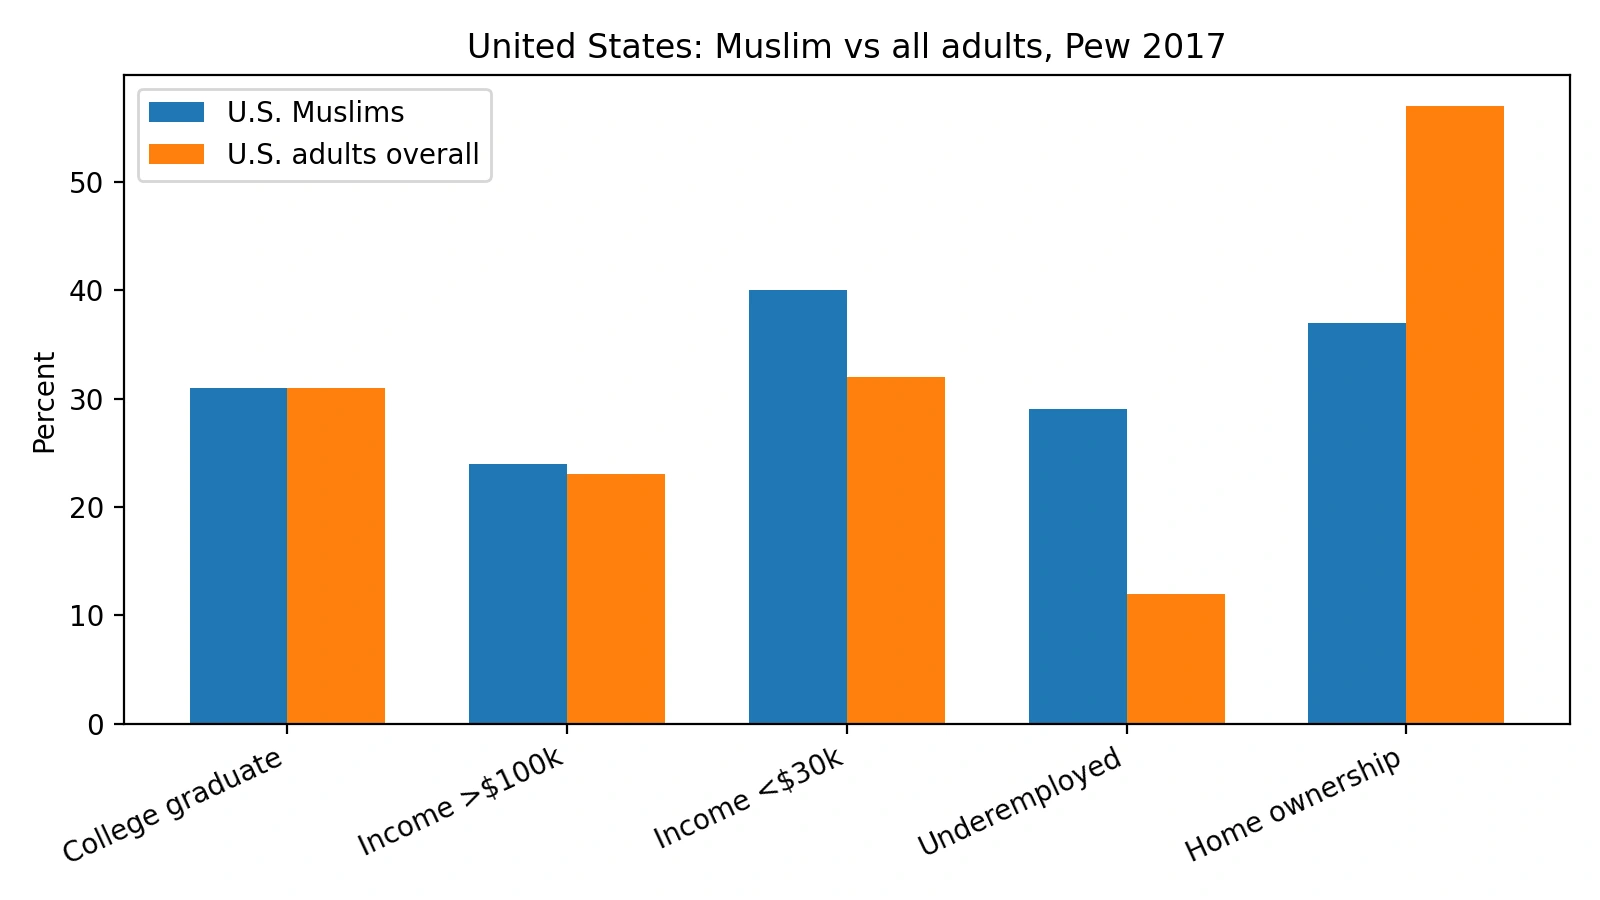
Indicator | U.S. Muslims (%) | U.S. adults overall (%) | Difference (pp) | Interpretation |
|---|---|---|---|---|
College graduate | 31 | ~31 | ~0 | Educational parity overall; immigrant Muslims often more educated than U.S.-born Muslims. |
Household income >$100k | 24 | 23 | +1 | High-income representation near parity. |
Household income <$30k | 40 | 32 | +8 | Higher low-income concentration. |
Underemployed | 29 | 12 | +17 | Large labour-market underutilisation gap. |
Home ownership | 37 | 57 | -20 | Substantial wealth/housing asset gap. |
8. Canada and Australia: available evidence but limited outcome comparability
Canada and Australia measure religious affiliation in the census, but public tables giving national Muslim-versus-non-Muslim employment, education and crime outcomes are not as readily available as ONS tables for England and Wales. Canada reported that the 2021 Census captured extensive religious and ethnocultural diversity, including more than 100 religions. Australia reported that Islam represented 3.2% of the population in 2021, after Christianity and no religion. These data establish demographic presence but do not by themselves provide a full integration-outcome comparison.
Country | What is measurable | What is missing for this report | Scientific interpretation |
|---|---|---|---|
Canada | Religion and ethnocultural diversity are measured in the 2021 Census; Muslim population share is available in national outputs. | A single public national table directly comparing Muslims with non-Muslims on employment, education and crime was not identified. | Do not rank Canada against ONS/Bertelsmann countries without microdata or harmonised survey data. |
Australia | ABS Census reports Islam at 3.2% of the population in 2021 and tracks religious diversity over time. | No public official Muslim-versus-non-Muslim national crime or labour-market outcome table was identified in the ABS summary material. | Demographic integration is measurable; socioeconomic parity requires additional custom census tables or microdata analysis. |
9. Crime and legal compliance
The requested comparison of “crime by percentage” cannot be done scientifically for most Western countries because official justice systems generally do not record or release offender religion. The UK Ministry of Justice publishes ethnicity and criminal justice statistics, not Muslim/non-Muslim offender statistics. Ethnicity is not religion: “Asian” includes Muslims, Hindus, Sikhs, Christians and people with no religion; “White” includes Muslims and non-Muslims; and many Muslims are Black, Arab, South Asian, Turkish, Iranian, Balkan or converts. Similar limitations apply in the United States, Canada and Australia.
Therefore, the correct scientific conclusion is not that Muslims have higher or lower criminality; it is that the public data do not permit a valid religion-specific offender-rate comparison. A valid crime analysis would need anonymised individual-level data linking religion, age, sex, socioeconomic status, geography, generation, ethnicity and offence type. Without those controls, any claim about Muslim criminality is methodologically unsafe.
10. Comparative conclusion
Best education/language outcome among the European survey countries: France, followed by the United Kingdom. France has the lowest early school-leaving among Muslims born in the country.
Best employment parity in the European survey: Germany and Switzerland show no significant employment gap by Muslim affiliation, while the UK appears favourable in the Religion Monitor but less favourable in Census 2021 administrative data.
Largest labour-market mismatch: France, where education is comparatively strong but unemployment is 14% for Muslims versus 8% for non-Muslims.
Largest social acceptance problem: Austria, with the highest Muslim-reported discrimination and the highest non-Muslim rejection of Muslim neighbours.
Strongest official within-country evidence: England and Wales, because ONS provides direct religion-based tables for employment, education, health and housing.
Most important general finding: high belonging and civic attachment coexist with socioeconomic disadvantage. Integration is therefore not a binary matter of loyalty versus non-loyalty; it is a multidimensional question of equal participation.
11. References
[1] Bertelsmann Stiftung. (2017). Muslims in Europe: Integrated but not accepted? Results and country profiles. Religion Monitor 2017. https://www.bertelsmann-stiftung.de/fileadmin/files/BSt/Publikationen/GrauePublikationen/Study_LW_Religion-Monitor-2017_Muslims-in-Europe_Results-and-Country-Profiles.pdf
[2] Office for National Statistics. (2023). Religion by housing, health, employment, and education, England and Wales: Census 2021. https://www.ons.gov.uk/peoplepopulationandcommunity/culturalidentity/religion/articles/religionbyhousinghealthemploymentandeducationenglandandwales/census2021
[3] UK Ministry of Justice. (2025). Statistics on ethnicity and the criminal justice system 2024. https://www.gov.uk/government/statistics/statistics-on-ethnicity-and-the-criminal-justice-system-2024
[4] Pew Research Center. (2017). U.S. Muslims concerned about their place in society, but continue to believe in the American dream. https://www.pewresearch.org/religion/2017/07/26/findings-from-pew-research-centers-2017-survey-of-us-muslims/
[5] Pew Research Center. (2017). Demographic portrait of Muslim Americans. https://www.pewresearch.org/religion/2017/07/26/demographic-portrait-of-muslim-americans/
[6] Statistics Canada. (2022). The Canadian census: A rich portrait of the country’s religious and ethnocultural diversity. https://www150.statcan.gc.ca/n1/daily-quotidien/221026/dq221026b-eng.htm
[7] Australian Bureau of Statistics. (2022). Religious affiliation in Australia. https://www.abs.gov.au/articles/religious-affiliation-australia
[8] Australian Bureau of Statistics. (2022). 2021 Census shows changes in Australia’s religious diversity. https://www.abs.gov.au/media-centre/media-releases/2021-census-shows-changes-australias-religious-diversity
[9] OECD / European Commission. (2023). Indicators of Immigrant Integration 2023: Settling In. OECD Publishing.
[10] Eurostat. (2025). Migrant integration statistics: labour market indicators.